We have moved to https://dokuwiki.librecad.org/
Lots of content was already moved to the new wiki, but there is still work to do. If you want to contribute, please register a new account at https://dokuwiki.librecad.org/
This wiki will be kept for a while to keep search engine results valid. Moved sites may be deleted here in future.
Spline tutorial 2
After you finished Spline tutorial 1 you may be ready for some additional remarks.
Splines in Librecad are special:
- (Closed) splines cannot be filled by hatching.
- Many line/circle operations are not possible, eg dividing by Modify / Divide.
- The density of spline knots (line segments) are defined globally for all splines in a drawing.
- In contrary to eg circles splines are not independent of scaling. Large magnification reveals its basic straight lines.
- Splines can be transformed into a composition of single stright lines, but lines cannot retransformed into splines.
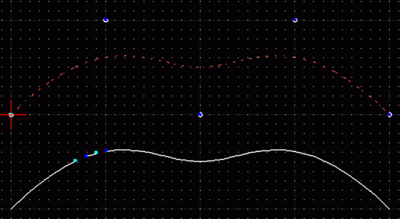
The diagram shows two curves. After selecting Draw / Spline" the five points (marked by white circles) from left to right were clicked. The last one requires an additional right click. The result is the upper spline curve. This curve was copied and moved below, selected and exploded by Draw / Explode.
You can see 5 blue control vertices of the first curve which appear after selecting the line. They are the points you clicked during drawing. You can edit the curve by moving them around. Exploding transformed the lower curve into a polygon line. Two line elements were selected by left mouse click. The number of line elements correlates with the line segments (knots) chosen in Edit / current drawing preferences / splines
Please note that the first and the last point of Librecad splines are special. These two control vertices are part of the curve itself. They form the starting and end point.

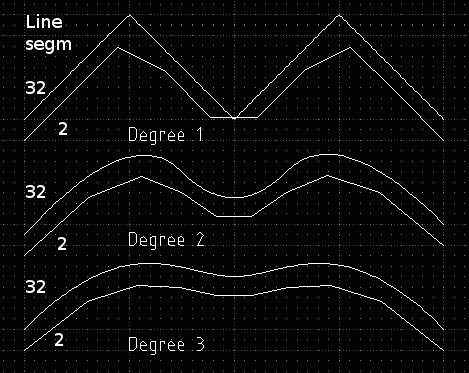
Superposition of two screendumps showing splines with 2 line segments and with 32 line segments
In the upper diagram the number of line segments per spline patch are 2 and 32 respectively. There are 5 fixpoints and you may expect around 8 and 128 segments in total respectively. The three curves visualize the influence of the degree of splines.
The diagram is a composition of two images. You cannot have different number of line elements in one drawing. In the moment you change the preferences all splines in the drawing will change.
Splines support the vectorizing of images.
Please open a new layer (Layer / Add new layer) and import the image you wish to convert into lines by Draw / Insert image. This way you can switch it on and off. If you miss the picture please unselect View / Draft. Change back to the layer where you will collect your drawing.
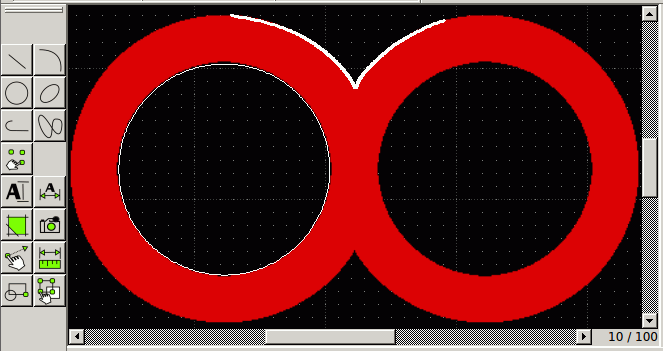
Because splines are limited in their post processing options try to avoid them. In the example the left inner circle was approximated by the 3-point circle tool ( Draw / Circle / 3 points). The same would be possible with the outer circles. You might divide and delete the cross sections of the two big circles later.
But there may be elements with are neither circles nor ellipses. The thick upper line shows the approximation of the boundary by a spline. The higher the gradient of the image the more control vertices should be set.
After finishing the spline drawings change to edit mode. Select (click) the spline and you should see the blue control points. You may move them around in order to improve the fitting. The fitting will be problematic near discontinouus boundaries, like the crossing point between the two circles.
If the global fittig is good enough you may explode the spline (Modify / explode, select spline, <enter>). Please remember that you cannot reverse this step. After exploding the spline is convertet into a collection of straight lines. Each single line can be selected and moved for a better fitting.

